
Data center mapping is the process of creating a dynamic, relational model of your IT infrastructure. It establishes a single source of truth for every physical, virtual, and logical asset—from servers and switches to applications, data flows, and their interdependencies.
This map is not a static diagram; it is the architectural foundation for modern IT operations, security, and compliance.
Why Inadequate Data Center Mapping Creates Unacceptable Risk
Undocumented infrastructure creates a minefield of operational fragility, security vulnerabilities, and compliance failures. For any CTO, product leader, or IT manager, the absence of an accurate infrastructure map is not an inconvenience; it is a significant architectural risk with direct business consequences.
The problem is compounded by the complexity of modern digital architectures, including distributed AI systems and stringent regulations like NIS2 and DORA. Relying on static diagrams, tribal knowledge, or spreadsheets for operational intelligence is a naive approach that cripples your team’s ability to respond effectively and creates blind spots that lead to systemic failures.
Here are the most critical business functions compromised by poor mapping:
- Incident Response: When an outage occurs, on-call engineers waste critical time identifying dependencies and root causes. This inflates Mean Time to Resolution (MTTR), leading to extended downtime and revenue loss.
- Security Posture: “Shadow IT” and forgotten legacy systems—unmapped and unmonitored—are prime targets for attackers. Without a complete asset inventory, vulnerability management is reactive and incomplete.
- Compliance and Governance: Proving compliance with regulations like GDPR is impossible without a definitive map showing where personal data resides, how it is processed, and which systems have access to it.
- Change Management: Attempting to migrate a service or deploy an update without a complete understanding of its dependencies is a primary cause of cascading failures and service disruptions.
The Problem of Scale and Complexity
This challenge is escalating with the sheer growth of infrastructure. In the United States alone, capacity is surging, with thousands of data facilities in operation and more under construction. You can explore the data behind this infrastructure boom on Axios. This massive expansion puts immense pressure on organisations to maintain visibility, whether their assets are in a major colocation facility or managed on-premises.
Effective data center mapping delivers a living, accurate model of your IT estate. It is not a one-time project but a continuous process that underpins the reliability, security, and maintainability of every digital product you build and operate.
Ultimately, investing in robust data center mapping is a strategic choice that dictates your ability to scale, respond to threats, and adapt to regulatory change. For businesses building resilient systems, understanding the architectural trade-offs is key; our guide on on-premises vs. cloud infrastructure offers more context on this critical decision. Ignoring this foundational discipline is a direct path to technical debt and operational fragility.
Starting with Scoping and Automated Discovery
A common failure pattern is attempting to map an entire data center at once. This “big bang” approach inevitably leads to overwhelming complexity, scope creep, and a failed project. A pragmatic strategy begins with a smaller, high-value target to secure a quick win.
Select a single, critical business service as your initial focus. This could be your core SaaS platform, a new AI-powered feature, or a revenue-generating application where downtime is unacceptable. By focusing on one contained but vital system, you transform an overwhelming initiative into a manageable project, deliver immediate value, and build momentum for broader adoption.
This focused effort is what transforms the chaos of undocumented infrastructure into the clarity required for modern operations.

A focused mapping project acts as the bridge between a tangled, high-risk environment and a well-understood, resilient system.
Moving Beyond Manual Discovery
Once you’ve defined your scope, the discovery phase begins. Manual processes, such as using spreadsheets, are a significant risk. They are prone to human error, become stale almost immediately, and cannot capture the dynamic nature of modern infrastructure. An inaccurate map is more dangerous than no map at all because it creates a false sense of security.
Instead, leverage automated discovery tools to build an accurate foundational inventory. This is the only reliable and efficient method for understanding your operational environment.
Key Automated Discovery Techniques:
- Network Scanners: Tools like Nmap can actively scan your network to identify live hosts, open ports, and running services, providing a baseline inventory of active assets.
- Infrastructure as Code (IaC) Parsers: If your teams use tools like Terraform or CloudFormation, their state files are an authoritative source. Parsing these files provides a precise record of intended infrastructure state, including VMs, networks, and security groups.
- Cloud Provider APIs: Directly querying the APIs for AWS, Azure, or Google Cloud is the definitive source for data on cloud resources. It offers the most accurate inventory of what is currently deployed.
The goal of discovery isn’t just to list assets. It’s to build a foundational inventory that includes hardware, software, data flows, and—most importantly—their business context.
This deeper understanding is essential for building a useful Configuration Management Database (CMDB), the designated single source of truth for your infrastructure.
A Real-World Mapping Scenario
Consider a multi-cloud application serving customers across Europe. The frontend runs on Azure, while data processing and analytics workloads run on AWS. A manual mapping approach would be an unmanageable exercise in collating data from different portals, teams, and static documents.
Here is how to tackle this with an automated, systematic approach:
- Start at the Edge: Identify the user-facing entry point, such as an Azure Application Gateway or another load balancer. This serves as your anchor point.
- Trace Application Dependencies: Use API queries and network flow logs to follow traffic from the load balancer to the web server VMs. On the VMs, identify the running application processes and their configurations.
- Cross the Cloud Divide: The web application calls a data processing service in AWS. Trace this connection across your VPCs or public internet links, paying close attention to firewalls and security group rules along the path.
- Map the Backend: Within AWS, map the backend service from its load balancer to the containerized services running on Amazon ECS or EKS. Finally, pinpoint the specific database instances (e.g., RDS) and storage buckets (S3) these services depend on.
This methodical, tool-driven process yields a complete and accurate map of one critical service. You now have a clear model of every dependency, potential point of failure, and the complete data flow. For your operations and security teams, this is a powerful and actionable asset, not just a diagram.
Building a Relational Data Model and CMDB
Automated discovery tools produce a large volume of raw data. The real engineering work lies in structuring this information into a coherent data model. Without this, you have disconnected lists of assets—a digital inventory, not an intelligent map. Siloed data lacks context, leaving you blind to the critical relationships that define your infrastructure’s behavior.
This is where a well-designed Configuration Management Database (CMDB) serves as your single source of truth. An effective CMDB moves beyond simple asset tracking to capture the intricate web of dependencies between components, acting as the central nervous system of your IT environment.
This model transforms isolated data points into a powerful relational map, providing the context required for intelligent decisions in operations, security, and compliance.
Designing a Pragmatic Data Model
A superficial CMDB lists servers and software. A pragmatic, high-value CMDB models relationships. Your goal should be to design a data model that connects technical assets to their business context, enabling you to answer complex questions with reliable data.
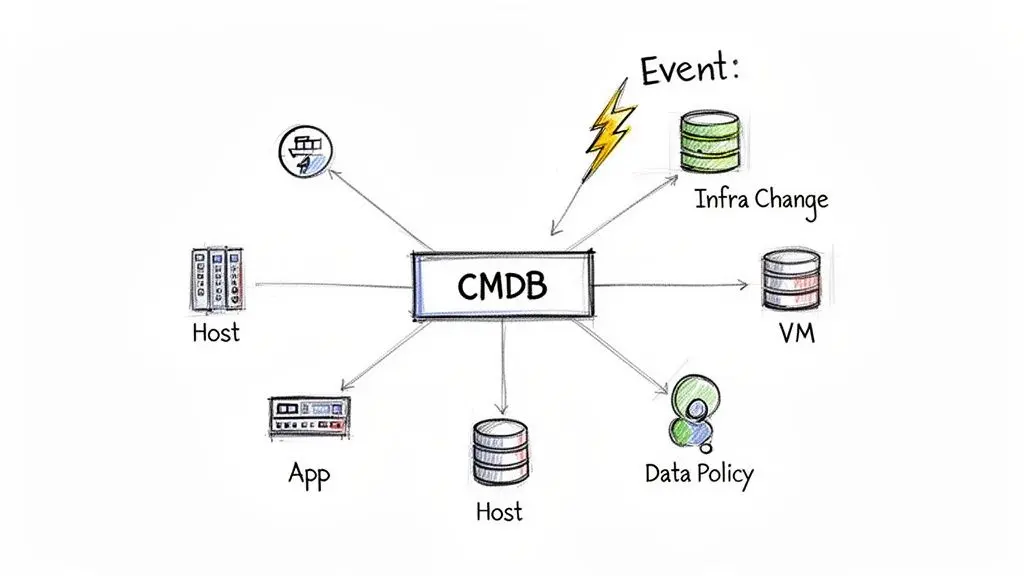
For example, a robust model doesn’t just show a virtual machine. It connects that VM to its:
- Physical Host: The specific hypervisor or server it runs on.
- Storage Volume: The LUN or storage array providing its disk space.
- Network Connections: The VLAN, switch, and port it’s connected to.
- Running Applications: The software services deployed on it.
- Business Service: The revenue-generating platform it supports.
- Data Policies: The specific GDPR or other regulatory controls that apply to the data it processes.
A well-structured data model is the difference between knowing what you have and understanding how it works. It is the architectural backbone for reliable operations and auditable compliance.
This level of detail is fundamental for effective governance. To see how this structured approach supports regulatory adherence, explore our guide on governance, risk, and compliance software. Building these relationships is a core business function, not just a technical exercise.
Automating CMDB Updates to Prevent Decay
The greatest risk in any data center mapping project is data decay. A CMDB that isn’t continuously updated becomes stale, creating a dangerous false sense of security. Manual updates are unreliable and cannot keep pace with dynamic environments.
Automation is the only sustainable solution. Integrating discovery tools directly with your CMDB is non-negotiable. This creates a closed-loop system where your map reflects operational reality in near real-time.
A powerful pattern for this is an event-driven workflow:
- A change occurs: A developer pushes a Terraform update, or a Kubernetes autoscaler launches a new pod.
- An event is triggered: The CI/CD pipeline, a cloud provider event bus (like AWS EventBridge), or a monitoring system emits an event detailing the change.
- The CMDB is updated: A listener function or script parses this event and automatically creates, updates, or decommissions the corresponding Configuration Item (CI) in the CMDB.
This workflow ensures your data model remains current and trustworthy. The demand for engineering teams capable of building and managing these automated systems is high. The physical data center landscape is also in constant motion, making flexible, continuously updated mapping essential.
Actionable Visualization for Different Stakeholders
Clean, structured data in a CMDB is necessary but not sufficient. If that information remains in database tables, its value is limited. The real utility of data center mapping is realized when raw data is transformed into purpose-built visualizations that different teams can use to make decisions.
A single, all-encompassing diagram is a recipe for failure. A network engineer troubleshooting latency and a compliance officer preparing for an audit ask fundamentally different questions. Effective mapping provides multiple, tailored views that give each team the precise information it needs, without extraneous noise.
This approach evolves your CMDB from a static data repository into a living, queryable tool that stakeholders actively use.
Data Center Visualization Approaches
A practical implementation requires a mix of visualizations, each serving a distinct audience and use case.
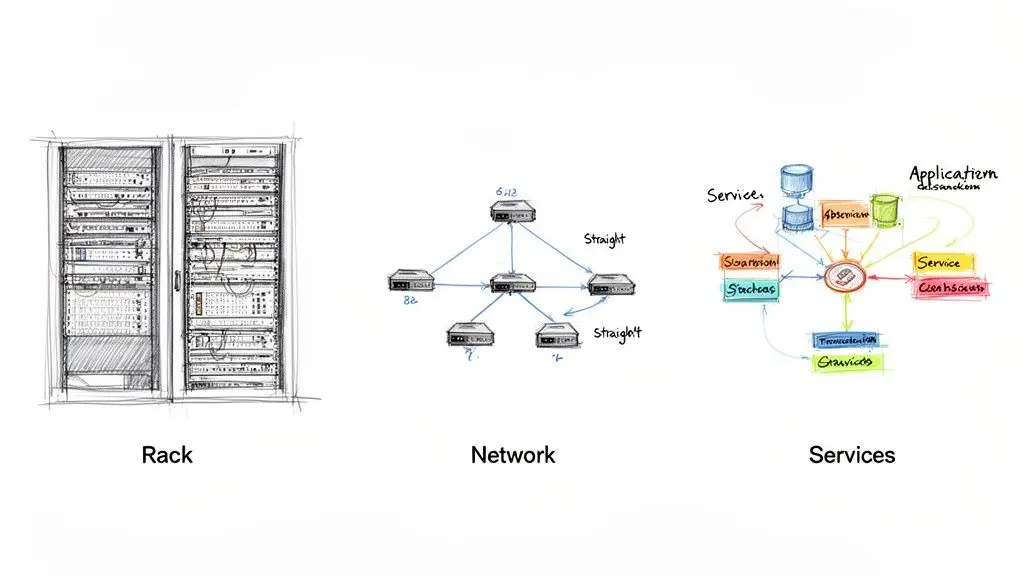
| Visualization Type | Primary Audience | Key Use Case | Example Tools |
|---|---|---|---|
| Rack Elevation | Data Centre Managers, Field Technicians | Capacity planning, power management, physical installations and troubleshooting | NetBox, Device42 |
| Topology Map | Network Engineers, SREs | Visualising network paths, troubleshooting connectivity, planning network upgrades | Grafana, Cisco DNA Center |
| Floor Plan | Facilities & DC Ops Teams | Space planning, heat mapping, asset location, managing structured cabling | DCIM Software Suites |
| Service Dependency Map | SREs, Architects, Product Owners | Understanding application dependencies, impact analysis, identifying single points of failure | ServiceNow Service Mapping, Dynatrace |
| Data Flow Diagram | Security & Compliance Teams | Auditing data sovereignty (GDPR, etc.), tracking sensitive data, proving compliance | Custom-built Views, Lucidchart |
These different views are essential for translating complex infrastructure data into clear, operational answers.
From High-Level Strategy to Ground-Level Compliance
Consider how this works for two very different roles.
A CTO requires a strategic overview. They are not concerned with which port a server is plugged into. They need a service dependency map that models how the company’s main SaaS platform is composed of various microservices, databases, and APIs. This view might immediately flag that two critical services rely on the same legacy database cluster—a classic single point of failure requiring architectural attention.
In contrast, a Compliance Officer facing a GDPR audit needs a different lens. They will use a data flow diagram that isolates all servers tagged as processing EU citizen data. This map shows precisely how that data moves between services, where it is stored, and which systems can access it. With a few clicks, they can answer the critical question: “Show me all infrastructure processing personal data and prove it never leaves our designated EU data boundary.”
A data map’s true value is unlocked when it empowers users to ask critical questions and get immediate, reliable answers. The focus must be on interactive visualisations that allow teams to drill down, filter, and query the map on demand.
This is the crucial shift: moving from static diagrams that are instantly obsolete to interactive tools that serve as the definitive source of truth for answering questions like, “Which customers will be affected if this switch fails?” or “Show me all production servers that haven’t been patched for this new vulnerability.”
Operationalizing Your Map for Automation and Security
When tied to a live CMDB, a detailed data center map ceases to be a mere reference document. It becomes a dynamic, operational asset—the central nervous system of your IT environment. Its real value emerges when this structured data drives automation, improves observability, and strengthens security posture.Powering Intelligent Automation and Observability
The primary weakness of most monitoring systems is a lack of context. An alert fires—“CPU at 95% on server X”—but what is the business impact? Who owns that server? What service depends on it? Without an integrated map, an on-call engineer wastes critical time searching for answers in wikis, spreadsheets, or chat logs.
An operationalized map enriches alerts with crucial context pulled directly from the CMDB.
Here is a practical implementation:
- Alert Triggered: A monitoring system flags a critical failure on a database server.
- Automatic Enrichment: Before the alert is routed, an automated workflow queries the CMDB using the server’s hostname.
- Context Delivered: The alert arrives in the engineer’s queue with a full dossier: the specific business service impacted (e.g., “Customer Authentication API”), the service owner’s contact details, and a dependency map showing which upstream applications are now at risk.
This workflow transforms a reactive scramble into a proactive, informed response, dramatically reducing Mean Time to Resolution (MTTR). The map provides the difference between knowing a server is down and understanding the entire checkout process is about to fail.
Strengthening Security and Proving Compliance
For security teams, a precise and current map is non-negotiable. Vulnerability scanners often produce long lists of findings tied to IP addresses, but that information is inactionable without context. Who is responsible for patching a specific server? Is the vulnerability on a low-impact development server or a mission-critical production database?
By connecting scanner outputs to the CMDB, you can automatically assign remediation tickets to the correct asset owners. This closes the loop between detection and resolution, creating clear accountability and shrinking your window of exposure.
A data map is not a project; it’s a continuous operational process. Its value lies in its ability to provide real-time context that fuels automation, accelerates incident response, and hardens security.
This continuous, documented view of your infrastructure is a core requirement for many modern regulations. Frameworks like the EU’s NIS2 Directive and the Digital Operational Resilience Act (DORA) demand that organizations maintain a clear, auditable inventory of their critical digital assets and their dependencies. A live, accurate map is no longer a best practice—it is a foundational component of your compliance strategy. As your business needs change, our guide on designing a cloud disaster recovery plan provides more strategies for building resilience.
Maintaining Your Map to Prevent Decay
The greatest threat to any mapping initiative is decay. An out-of-date map is worse than no map at all, as it fosters a dangerous and false sense of security. To prevent this, you must establish clear maintenance workflows that treat the map as a living product, tied directly to your change management processes.
- Integrate with CI/CD: When new infrastructure is provisioned with Terraform or another IaC tool, the pipeline must automatically trigger a CMDB update.
- Automate Decommissioning: When a VM is destroyed, an automated process must remove it and its relationships from the map to prevent “ghost” assets.
- Schedule Regular Audits: Use automated discovery tools to periodically scan the environment. Compare the findings against the CMDB and flag any discrepancies for review.
The physical data center landscape is also in constant flux. The data centre map is being redrawn across North America, with a significant portion of new construction happening in emerging markets. Much of this new capacity is pre-committed to support AI workloads that can require up to 120kW per rack, according to research from jll.com. This dynamic makes it clear: you need a flexible, continuously updated mapping strategy that can handle rapid changes in both physical location and resource density.
Answering Key Data Center Mapping Questions
Even with a clear strategy, mapping a complex environment raises practical questions. Technical leaders require answers drawn from real-world implementation experience. Let’s address the most common challenges.
We Have No Documentation. Where Do We Start?
Avoid the ‘big bang’ approach; it is the fastest path to failure.
The most pragmatic way forward is to target a single, high-value service. Select your main SaaS application, a critical customer-facing system, or a new AI workload. This sharp focus prevents the scope creep that dooms ambitious mapping projects.
Map its complete dependency chain, from the load balancers down to the databases. This delivers a valuable vertical slice quickly, proving the concept to stakeholders and allowing your team to refine its process on a manageable scale. Use automated discovery tools for this limited scope, populate a lean CMDB, and create a service-level visualization. This first win builds the momentum required for expansion.
How Do We Prevent the Map from Becoming Instantly Obsolete?
Map decay is the primary reason these initiatives fail. The only effective solution is to integrate the mapping process directly into your operational workflows, particularly your CI/CD and Infrastructure as Code (IaC) pipelines.
Manual updates should be the rare exception, not the rule.
When a new server is provisioned with Terraform, a script must automatically update its entry and relationships in your CMDB. When a new application version is deployed, the pipeline must update its software dependencies. This is not optional for maintaining an accurate map in a dynamic environment.
By tying the map’s state to your automated change management process, you ensure it remains a living, accurate reflection of your environment. It transforms the map from a static document into a real-time operational tool.
Treat your map not as a one-time project, but as a product with its own lifecycle, integrated directly into the engineering toolchain.
What Are the Real Risks of a Superficial Mapping Approach?
A one-off, manually-drawn diagram creates a dangerous false sense of security. It gives the illusion of control while obscuring critical vulnerabilities. The risks of a shallow mapping effort are significant and far-reaching:
- Flawed Incident Response: During an outage, teams waste critical time working from an inaccurate map. This prolongs downtime and directly impacts customer satisfaction and revenue.
- Guaranteed Audit Failures: A compliance audit for regulations like DORA or NIS2 will quickly reveal that your documentation does not match operational reality, resulting in potential penalties and reputational damage.
- Pervasive Security Blind Spots: Unmapped “shadow IT” and forgotten legacy systems become unpatched, unmonitored entry points for attackers.
- Inefficient Cost Management: Without a clear, relational map, you cannot accurately forecast capacity or identify underutilized resources, leading directly to overprovisioning and wasted expenditure.
A bad map is often more dangerous than no map at all. It fosters misplaced confidence while your actual operational risk climbs. An effective data centre mapping strategy must be deep, automated, and continuous.
At Devisia, we build reliable digital products by making pragmatic architectural choices from day one. If you need to bring clarity to your systems, modernise a platform, or integrate AI with robust governance, we provide a clear path to meaningful, maintainable software. Learn how we turn business vision into reality at https://www.devisia.pro.