For a technical leader, business analytics software is not a collection of charts but an engineered system for converting raw operational data into strategic intelligence. The core problem is common: organisations are rich in data from myriad SaaS tools, databases, and logs, yet lack reliable, actionable insights. This is not a reporting failure; it is an architectural one.
Moving Beyond Dashboards to True Business Intelligence
Many organizations collect vast amounts of operational data but fail to unlock its value. Without a robust system to ingest, process, and analyze this data, it becomes a liability—siloed, noisy, and creating more confusion than clarity. The objective is to transition from reactive dashboards to proactive, intelligent decision-making systems.
Consider the architecture of a municipal water treatment system. Raw water from various sources (rivers, reservoirs) is analogous to raw data from databases, APIs, and event streams. The treatment plant represents the business analytics software, performing critical functions:
- Ingestion: Collecting raw data from all sources.
- Transformation: Filtering, cleansing, and structuring the data to meet quality standards. This corresponds to data modeling and ETL/ELT processes.
- Distribution: Delivering processed, reliable insights through a governed network to end-users.
An Architectural Mindset
Viewing analytics through this lens reframes the problem. A simple dashboard connected directly to a production database is equivalent to drinking untreated river water. The data is unfiltered, lacks context, and querying it directly can degrade the performance of the core application. This is a common but naive approach that introduces significant operational risk.
A proper business analytics system is infrastructure. Its design requires deliberate architectural choices regarding data collection, storage, transformation, and governance. This is the only way to ensure the delivered insights are accurate, secure, compliant, and trustworthy.
A frequent mistake is treating business analytics as a reporting add-on. True intelligence requires applying the same engineering rigor to your data pipeline as you do to your core product. It is a foundational system, not an afterthought.
This pragmatic mindset is crucial. For founders and CTOs, the conversation must shift from “What charts do we need?” to “What is the most reliable and secure architecture for converting operational exhaust into strategic assets?” Answering this question correctly determines whether your business analytics software becomes a scalable engine for growth or a collection of brittle, disconnected reports.
Designing a Modern Data Architecture
The engineering backbone of your business analytics software dictates its performance, reliability, and total cost of ownership. A modern approach moves beyond rigid, monolithic systems toward a flexible, composable architecture where data storage, processing, and visualization are decoupled components.
The central data repository is the foundation of this design. The choice is not merely between structured and unstructured data but about selecting the optimal storage model for specific workloads and query patterns. This decision directly impacts performance, operational cost, and future flexibility.
Data Storage Models: Warehouse, Lake, and Lakehouse
Choosing the right storage model is the first critical architectural decision. Each option presents distinct trade-offs in structure, performance, and flexibility. A naive choice here can create significant technical debt and performance bottlenecks.
- Data Warehouse: A highly structured repository optimized for fast SQL queries and business reporting. Data is cleansed, structured, and loaded into a predefined schema (schema-on-write), making it ideal for consistent, repeatable analysis. Its rigidity, however, makes it unsuitable for raw, unstructured data or exploratory data science.
- Data Lake: A vast repository that stores raw data in its native format (schema-on-read). It offers maximum flexibility for data scientists working with diverse data types (logs, images, text), but without strong governance, it can degrade into a disorganized and unusable “data swamp.” Query performance can also be a significant issue.
- Data Lakehouse: A hybrid model that combines the benefits of both. It implements data warehouse-like structures and management features (e.g., ACID transactions) directly on top of low-cost data lake storage. This architecture supports both traditional BI and machine learning workloads on the same data repository.
This diagram illustrates the high-level data flow, from disparate raw data sources through the analytics system to produce structured, actionable insights.
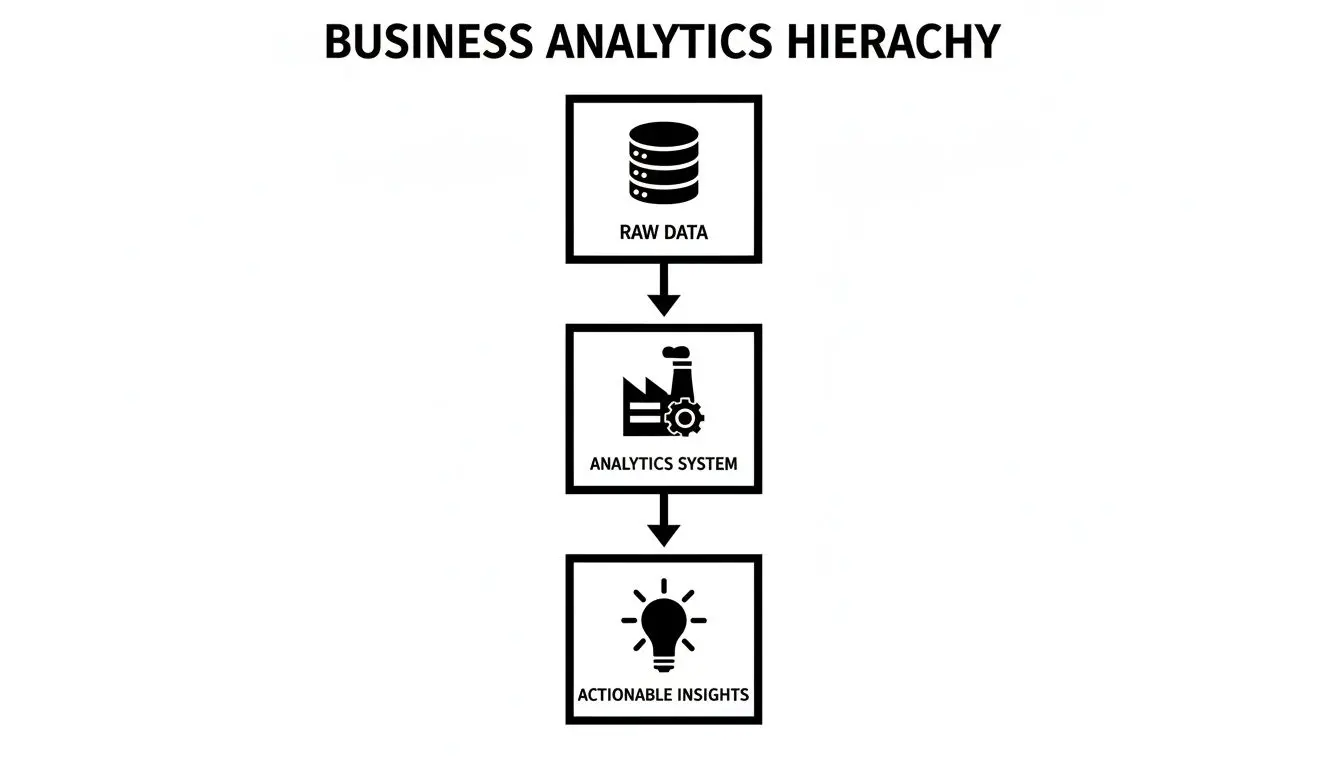
The visualization clarifies that the analytics system is the critical engine transforming chaotic inputs into structured, strategic outputs.
From Rigid ETL to Flexible ELT Pipelines
The method for moving data into the repository has also evolved. The traditional ETL (Extract, Transform, Load) approach requires data transformation before loading it into the warehouse. This process is brittle; any change to the transformation logic necessitates re-engineering the entire pipeline.
Modern, cloud-native architectures favor ELT (Extract, Load, Transform). With this pattern, raw data is loaded directly into the data lake or warehouse first. Transformations are executed later, within the repository, leveraging the platform’s scalable compute resources.
The shift to ELT is a strategic architectural change, not just a technical one. It decouples data ingestion from data modeling, enabling greater agility. Raw data is preserved, and different teams can apply their own transformations for various use cases without disrupting the core ingestion pipeline.
This decoupling is a core principle of a composable architecture, which avoids monolithic, single-vendor solutions in favor of specialized, interoperable components.
The Composable Analytics Stack
A composable stack treats each function—ingestion, storage, transformation, visualization—as a replaceable service connected via well-defined APIs. This approach mitigates vendor lock-in and allows for best-of-breed tool selection for each job. A typical modern stack includes:
- Data Connectors: Tools like Fivetran or Airbyte manage the “E” and “L” of ELT, reliably ingesting data from hundreds of sources into your central repository.
- Transformation & Orchestration: Frameworks like dbt and Airflow manage the “T,” scheduling and executing complex data transformation workflows with dependency management and failure handling.
- Visualization Engines: Platforms like Tableau, Power BI, or open-source alternatives like Metabase connect to the prepared data to build dashboards and reports.
Assembling these components creates a resilient and adaptable system. If a superior visualization tool emerges, it can be swapped in without re-architecting the entire data pipeline. This philosophy aligns with a Service-Oriented Architecture (SOA), an architectural style that reduces the maintenance risks of tightly coupled systems and provides a strategic advantage for long-term scalability.
The Strategic Build vs. Buy Decision
Choosing between off-the-shelf business analytics software and a custom-built solution is a critical decision with long-term strategic implications. It defines control over data, operational scalability, and competitive differentiation. The correct choice depends on your specific context, technical capabilities, and business objectives.
Buying a subscription to a platform offers speed. You can connect data sources and deploy dashboards in days. However, this velocity comes with trade-offs: vendor lock-in, recurring operational expenditures, and limitations on customization. Business workflows must conform to the tool’s capabilities.
Building a custom solution provides complete ownership and control. The system can be precisely engineered to your unique business logic, security posture, and data models. This path requires a significant upfront investment in engineering and a long-term commitment to maintenance, security, and evolution. It is not a project; it is a product with a life cycle.
Key Evaluation Questions
A superficial analysis at this stage often leads to building a solution that should have been bought or buying a tool that creates more friction than it solves. A pragmatic evaluation is required.
Consider these questions:
- Is analytics a core business differentiator? If your method of data analysis provides a unique competitive advantage, a custom build may be necessary to protect that intellectual property.
- How specialized are our data and workflows? Standard tools excel with standard data. If your processes involve complex, domain-specific transformations, a custom build could be more efficient long-term.
- What are our compliance and data residency requirements? For organizations managing sensitive data under regulations like GDPR, NIS2, or DORA, a custom solution offers granular control over data location, processing, and security, ensuring auditable compliance.
- What is our realistic engineering capacity and expertise? Be honest about your team’s ability to build and maintain a complex data platform. It is not a side project; it requires dedicated ownership and specialized skills.
The decision hinges on whether you are solving a generic or a unique problem. For standard business dashboards, buying is almost always the correct choice. If your analytics needs are inseparable from your product’s core value proposition, building becomes a strategic imperative.
Scenarios Illustrating the Choice
Consider two scenarios. A seed-stage startup needs to validate product-market fit quickly. For them, buying an off-the-shelf tool is the logical choice. It allows them to focus scarce engineering resources on the core product while obtaining essential usage metrics.
Contrast this with an enterprise in the financial services sector building a predictive fraud detection system using proprietary risk models. The security requirements, need for total data control, and unique algorithms make a custom, AI-powered system the only viable path. Building a bespoke platform is a serious undertaking, and our guide on how to build custom software without creating future problems offers a deeper architectural perspective.
The trade-offs are significant. The following table provides a pragmatic comparison.
Build vs. Buy: A Pragmatic Comparison
| Consideration | Building Custom Software | Buying Off-the-Shelf Software |
|---|---|---|
| Initial Cost & Time | High upfront capital expenditure in development; months to years. | Low initial cost (subscription); days to weeks to implement. |
| Total Cost of Ownership | Ongoing operational expenditure for maintenance, hosting, and developer salaries. | Predictable but perpetual subscription fees that scale with usage. |
| Customization | Unlimited. Tailored precisely to unique workflows and business logic. | Limited. Workflows must adapt to the tool’s features and constraints. |
| Competitive Advantage | High potential. Can be a core differentiator and intellectual property. | Low. Competitors likely use the same or similar tools. |
| Control & Security | Complete control over data, security architecture, and compliance implementation. | Dependent on the vendor’s security posture and data policies. |
| Maintenance Burden | Your team is responsible for all updates, bug fixes, security patching, and uptime. | The vendor handles all maintenance, updates, and support. |
Neither path is inherently superior; they serve different strategic objectives.
This context is especially relevant in mature markets. North America, for instance, is projected to command a 38% share of the global enterprise business analytics software market in 2025. The region’s market is expected to hit USD 57.0 billion that year, as firms turn system performance logs into insights that can improve operational efficiency by up to 30%. You can discover more insights on the enterprise analytics market from SkyQuest. This growth highlights the strategic value placed on data, making the build vs. buy decision more critical than ever.
Integrating AI for Predictive and Prescriptive Analytics
Standard business intelligence answers historical questions: “What were last quarter’s sales?” Strategic advantage, however, comes from foresight. Integrating artificial intelligence into your business analytics software enables this transition from historical reporting to predictive and prescriptive insights.
This is a deliberate engineering decision to move beyond descriptive analytics (“what happened”) to the more valuable realms of predictive (“what will likely happen”) and prescriptive (“what should we do about it”) analytics. A naive approach, such as connecting a chatbot directly to a database, is an anti-pattern that introduces unacceptable risks related to performance, security, and data accuracy.
A robust AI integration requires a thoughtful architecture. AI models must be treated as services demanding the same engineering discipline, security, and monitoring as any other component in your technology stack. This approach ensures reliability, manages cost, and maintains control over data.
Practical AI Integration Patterns
Several architectural patterns provide a solid foundation for integrating AI into an analytics workflow. These patterns prioritize maintainability, scalability, and governance, avoiding the pitfalls of tightly coupled, monolithic systems.
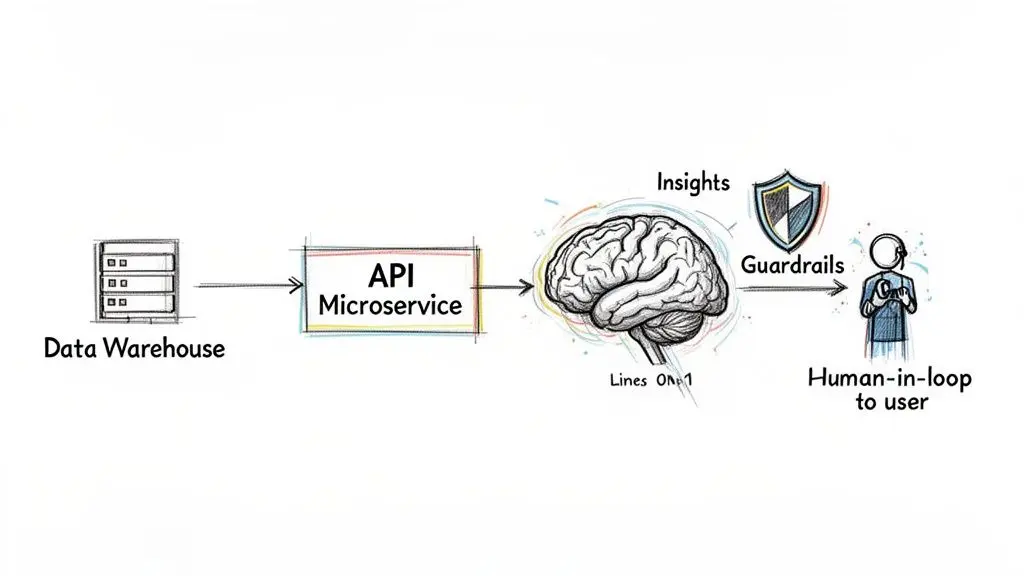
A common and effective pattern utilizes API-driven microservices to serve AI models. The analytics platform communicates with a model through a well-defined API endpoint, decoupling the model’s life cycle from the analytics front end. This allows data science teams to retrain and deploy new model versions without disrupting the user-facing application.
Practical implementations include:
- Natural Language Querying: An LLM can be integrated to translate plain-language questions—e.g., “Show me our top ten customers by revenue in the EU last month”—into precise SQL queries. This requires careful prompt engineering and a validation layer to prevent incorrect or malicious query execution.
- Anomaly Detection: Time-series models can be deployed to proactively monitor system health or business KPIs. An API can receive a stream of metrics (e.g., application response times) and trigger an alert upon detecting a deviation from normal patterns, enabling pre-emptive action.
- Agentic Workflows: An automated AI agent can perform multi-step data analysis. For instance, an agent could be tasked to investigate a sales dip by first pulling sales data, then cross-referencing it with marketing campaign data, and finally summarizing its findings in a structured report.
The objective is to embed intelligence within a reliable, fault-tolerant system. This means building for failure, with clear fallbacks, monitoring, and validation to ensure that if a model fails or returns an invalid result, the system handles it gracefully without compromising data integrity or security.
Governance and Guardrails: A Non-Negotiable Foundation
AI introduces new risk vectors. An unconstrained LLM connected to your data can hallucinate incorrect answers, leak sensitive information, or incur significant costs through excessive API calls. Governance is therefore a critical engineering discipline, not an administrative afterthought.
Implementing robust guardrails is the first line of defense. These include technical controls like input validation to reject out-of-scope queries and content filters to prevent the processing or exposure of personally identifiable information (PII). This defines a strict operational boundary for the AI.
A human-in-the-loop (HITL) validation process is essential for critical decisions. If a model recommends a significant pricing change, that recommendation should not be executed automatically. Instead, it must be flagged for review by a human expert who can apply business context and provide final approval. This creates a vital feedback loop for model improvement.
Finally, rigorous cost monitoring and rate limiting are essential operational controls. They prevent an automated query or a logic loop from generating an unexpectedly large bill from your AI service provider.
Your Implementation Roadmap and Governance Framework
Deploying business analytics software is a strategic program requiring a clear roadmap and robust governance, not a one-off technical project. The “big bang” launch—building a massive, all-in-one system in isolation—is a high-risk approach known for budget overruns, missed deadlines, and a final product that fails to solve the intended business problems.
A superior strategy is to adopt a product mindset, prioritizing the incremental delivery of business value. This phased approach mitigates risk, accelerates return on investment, and builds stakeholder trust.
The Phased Rollout: A Pragmatic Approach
Start with a single, high-impact use case to prove value quickly and establish a foundational data pipeline. By concentrating engineering efforts on one well-defined problem, you can deliver tangible results rapidly. A common starting point is analyzing customer churn, as it has a direct, measurable impact on revenue.
- Phase 1: Deliver a Core Use Case: Focus on building the data pipeline required to track churn. This involves identifying data sources (e.g., subscription database, user activity logs), implementing a reliable ELT process, and creating a simple dashboard to visualize key churn metrics.
- Phase 2: Expand and Enrich: Once ROI is demonstrated, expand the system. Ingest new data sources, such as customer support tickets or marketing engagement data, to enrich the churn analysis and move from tracking what is happening to understanding why.
- Phase 3: Introduce Advanced Analytics: With a solid data foundation, integrate predictive models. A model could forecast which customers are at high risk of churning, enabling proactive intervention by customer success teams.
- Phase 4: Scale and Standardize: Replicate this success across other business domains. Apply the established architecture and governance principles to tackle other problems, such as marketing attribution or operational efficiency, progressively building out a comprehensive analytics platform.
This iterative roadmap ensures each project stage is grounded in business needs and delivers measurable outcomes.
Building Governance from Day One
Governance is not bureaucracy; it is the framework that ensures data is accurate, secure, and used responsibly. Architecting it from the start prevents technical debt and compliance failures. Treating governance as an afterthought leads to a “data swamp”—a repository filled with untrustworthy, unusable information.
Key pillars of a strong governance framework include:
- Data Quality Management: Implement automated checks and validation rules within data pipelines to detect inconsistencies, duplicates, and errors before they corrupt downstream analytics.
- Access Control: Implement role-based access control (RBAC) to ensure users can only access data they are authorized to view. This is fundamental for security and privacy by design.
- Compliance by Design: Architect the system from day one to meet regulatory requirements like GDPR, NIS2, and DORA. This includes data anonymization techniques, auditable data retention policies, and immutable logs of data access.
Governance should be automated and embedded within your architecture. Manual checks are brittle and do not scale. The goal is to make compliant behavior the path of least resistance for all teams.
The global context reinforces this need. The Asia-Pacific region is the fastest-growing market for enterprise business analytics software, driven by rapid digitalization. The shift to cloud BI, which held a 53% market share globally in 2025, is accelerating there. Indian IT services firms, for instance, are using analytics to automate workflows, cutting deployment times by 25% while managing petabytes of data. This rapid expansion underscores that a solid governance framework is essential for sustainable growth.
Building this framework requires clear standards. For practical guidance, see our guide to creating a Code of Conduct for Engineering and AI Teams. A well-defined implementation roadmap paired with a robust governance model transforms an analytics initiative from a high-risk project into a reliable engine for strategic decision-making.
From Actionable Data to Strategic Decisions
The principal takeaway is that business analytics software is not a commodity tool but a strategic system that requires intentional engineering. The path from raw data to a confident decision is built on deliberate architectural choices, each with material trade-offs in cost, reliability, and security.
A superficial approach—treating analytics as a last-minute dashboarding exercise—inevitably leads to brittle, untrustworthy systems that create more confusion than clarity. The correct approach begins with a modern data architecture designed to support your specific operational and strategic needs.
The Pillars of a Resilient System
The next critical step is a rigorous evaluation of the build vs. buy decision. This choice dictates control over your data, capacity for customization, and total cost of ownership. Similarly, integrating AI demands a focus on governance and reliability to deliver genuine intelligence, not just risk.
Adopting a phased, value-driven implementation plan allows for rapid ROI demonstration and avoids the common “big bang” failure mode. This incremental approach is what transforms data from a passive asset into an active driver of strategic decisions.
Thinking critically about these pillars—architecture, build vs. buy, AI governance, and phased implementation—is what separates a simple collection of charts from a resilient, scalable engine for growth.
By grounding your analytics strategy in these pragmatic engineering principles, you build a system that delivers insights that can be trusted. This foundation empowers your organization to act with confidence, converting complex data into a clear competitive advantage. Ultimately, a well-architected analytics system becomes the central nervous system of a data-driven business, enabling faster, smarter decisions at every level.
Frequently Asked Questions
Direct answers to common questions from technical leaders evaluating or implementing business analytics software.
How Can We Ensure Data Quality Across Multiple Sources?
Data quality issues are a primary cause of analytics project failure. The solution is architectural, not manual.
First, build data validation and quality checks directly into your ELT pipelines. Tools like dbt (Data Build Tool) allow you to define and automate tests for nulls, incorrect data types, or outliers during the transformation process. Second, establish a clear data ownership model where specific teams are accountable for the quality of data from their respective domains.
This combination of automated validation and human accountability produces trustworthy data.
What Is The Most Common Security Risk To Avoid?
The most dangerous and common mistake is granting visualization tools direct access to a production database. This anti-pattern creates a direct path to sensitive data, bypasses security controls, and can cause severe performance degradation of your operational systems.
A secure architecture connects analytics tools exclusively to a dedicated, read-only data warehouse or data mart. Within the warehouse, implement role-based access control (RBAC) and data masking to ensure users access only the data they are authorized to see. This approach isolates analytics workloads and embeds security by design.
Giving business intelligence tools direct access to a production database is an architectural anti-pattern. It couples your analytics directly to your operations, introducing security vulnerabilities and performance degradation that are difficult to untangle later.
How Do We Manage The Costs Of AI Integration?
For AI-powered analytics, the primary cost drivers are API consumption and compute resources for model training. To control these costs, implement strict rate limits and budget alerts on all third-party AI service APIs. This prevents a runaway script from generating a massive, unexpected invoice.
For custom models, focus on efficient data preprocessing and selecting the appropriate model size for the task—larger models are not always better and incur higher costs. Finally, implement caching strategies. Storing and reusing the results of frequent or expensive queries is a simple but effective technique to reduce redundant API calls and manage operational expenditures.
At Devisia, we architect and build reliable, maintainable business analytics software and AI-enabled systems designed around your workflows. We help you turn complex data into a clear strategic advantage. See how we can help you build a resilient analytics platform.