
For technical leaders in SaaS and custom software, marketing success isn’t defined by website traffic or social media engagement. It’s measured by a quantifiable contribution to revenue and sustainable growth. The problem is that many organisations operate in a “Marketing Data Mirage”—a state where dashboards glow green with positive metrics while business goals are consistently missed.
This guide explains the problem of superficial metrics, presents a framework for defining meaningful marketing performance indicators (MPIs), and outlines the architectural considerations for building a reliable measurement system.
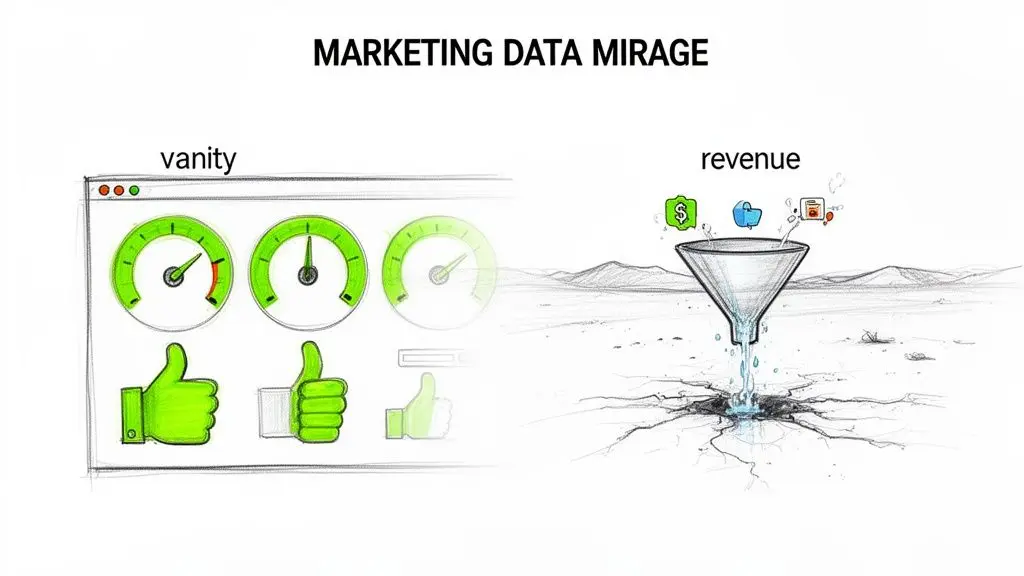
The Problem: The Marketing Data Mirage
The Marketing Data Mirage is a common and costly scenario for B2B technology companies. It occurs when marketing teams focus on vanity metrics—superficial indicators that appear impressive but have no direct or causal link to business outcomes like revenue or pipeline growth.
Founders and CTOs are shown reports packed with high engagement, soaring click-through rates, and growing follower counts. These numbers suggest success but often mask a critical disconnect from what truly matters: the sales pipeline and profitability.
This isn’t an isolated issue. The 2026 State of Performance Marketing Report found that, on average, 25% of marketing spend fails to drive any business outcome. That figure rises to 30% for companies that rely on frequently misleading data. More tellingly, two-thirds of leaders admit their dashboards often show success that doesn’t translate to revenue. You can review the full findings of this marketing data report from DemandScience.
Risk: The High Cost of Inflated Intent Signals
For businesses selling complex software, AI systems, or mission-critical digital architecture, this danger is particularly acute. The B2B sales cycle is long and involves multiple technical and business stakeholders. A “lead” from a whitepaper download may be a student researcher, not a CTO with purchasing authority.
Treating all such interactions as signals of genuine intent leads to severe operational and strategic problems:
- Wasted Budgets: Resources are allocated to channels that generate high volumes of low-quality leads, starving the initiatives that attract qualified buyers.
- Misaligned Sales & Engineering Efforts: The sales team wastes valuable time pursuing contacts that will never convert, creating friction and eroding trust between departments. Engineering resources may be diverted for demos for non-prospects.
- Flawed Strategic Decisions: Believing marketing is performing well, leadership makes poor decisions regarding market expansion, product development, or financial forecasts.
The core issue is confusing activity with progress. A dashboard filled with top-of-funnel metrics like impressions and clicks is analogous to a server’s CPU running at 100%—it indicates high activity but says nothing about the actual work being accomplished.
The Solution: An Architectural Approach to Measurement
To escape this mirage, technical leaders must champion an architectural approach to measurement. This means moving beyond standard dashboard widgets and deliberately engineering a system of marketing performance indicators (MPIs). These are not just any metrics; they are a curated set of indicators with a direct, quantifiable link to revenue and strategic business objectives.
An architectural mindset treats the measurement framework like a software system. It requires:
- Clear Requirements: Defining precisely what business questions the data must answer.
- Robust Design: Selecting MPIs that are resistant to manipulation and truly reflect business health.
- Data Integrity: Architecting a pipeline that ensures the underlying data is accurate, consistent, and reliably sourced.
This rigorous perspective is the only way to build a marketing function that is accountable, predictable, and a true driver of growth. It shifts the entire conversation from “How many leads did we get?” to “What was our marketing-sourced revenue and at what cost?” This is the foundation for transforming marketing from a perceived cost centre into a scalable growth engine.
Defining Actionable Marketing Performance Indicators
To move beyond the mirage of superficial activity, it is crucial to differentiate between metrics that track activity and those that measure progress. This is the distinction between generic Key Performance Indicators (KPIs) and true marketing performance indicators (MPIs).
An MPI is a metric with a direct and demonstrable causal link to a business outcome. For example, website visits are a metric. Customer Acquisition Cost (CAC), on the other hand, is an MPI because it directly connects marketing expenditure to the acquisition of a paying customer.
From Vague Goals to Specific MPIs
Goals like “increase brand awareness” or “generate more leads” are too ambiguous to be effective and often lead to wasted marketing spend. They lack the specificity required for accountability. The solution is to translate high-level business objectives into concrete, measurable MPIs.
An actionable MPI is a metric that, when it changes, compels a specific business decision. If a metric moves and you don’t know what action to take—or don’t need to—it is not a performance indicator; it is merely data.
For a B2B software company, this means tying every marketing action to pipeline and revenue. Instead of tracking social media engagement, the focus shifts to metrics that predict sales outcomes.
- Cost per Qualified Lead (CPQL): Measures the efficiency of attracting leads that meet your Ideal Customer Profile (ICP), filtering out unqualified noise.
- Lead-to-Opportunity Conversion Rate: Shows the percentage of qualified leads that the sales team accepts and converts into a formal sales opportunity. It is a direct measure of marketing and sales alignment.
- Marketing-Sourced Revenue: Tracks the total contract value originating directly from marketing initiatives. It is an unambiguous measure of financial impact.
A Framework for Selecting Your MPIs
The correct marketing performance indicators are determined by your business model, sales cycle, and customer acquisition process. A high-volume, low-touch SaaS product will have different MPIs than a company selling multi-million-dollar enterprise software contracts. The key is to map core business goals to the metrics that reflect them.
This framework provides a blueprint for connecting abstract goals to actionable MPIs, creating a clear line of sight from a marketing campaign to its impact on the bottom line.
Mapping Business Goals to Core Marketing Performance Indicators
| Business Goal | Corresponding MPI | Why It Matters for B2B Tech |
|---|---|---|
| Increase Profitable Growth | Customer Lifetime Value to Customer Acquisition Cost Ratio (LTV:CAC) | This is the ultimate measure of a sustainable business model. It validates that the total value derived from a customer exceeds the cost to acquire them. A ratio below 3:1 often indicates an unprofitable growth strategy. |
| Improve Sales Pipeline Efficiency | Marketing Qualified Lead (MQL) to Sales Qualified Lead (SQL) Conversion Rate | This measures the quality of leads being passed to sales, directly reflecting marketing and sales alignment. A low rate prevents the sales team from wasting time on unqualified contacts. |
| Validate Market Demand | Demo Request or Trial Signup Rate | This is a direct signal of buying intent and product-market fit. It is far more valuable than vanity metrics like content downloads or webinar attendance, as it indicates active evaluation. |
| Accelerate Revenue Generation | Sales Cycle Length (Marketing-Influenced) | This tracks the time from a marketing-sourced lead’s first touchpoint to a closed deal, showing how effectively marketing activities are shortening the path to revenue. |
By adopting this disciplined approach, you replace vanity metrics with a focused set of indicators that provide a true, unvarnished view of your growth engine’s health. It ensures every dollar of marketing spend is accountable to a specific, measurable business outcome.
Mapping MPIs Across The B2B Customer Journey
Defining your marketing performance indicators is the first step. True operational utility comes from mapping them to the actual journey a prospect undertakes before becoming a customer. A generic sales funnel is insufficient for complex B2B technology. The path from discovery to purchase is not a straight line; it is a complex process involving multiple technical and business stakeholders, rigorous evaluations, and proof-of-concept projects. Your MPIs must reflect this reality.
Acquisition Stage: Attracting and Qualifying Prospects
The objective of acquisition is not to generate traffic, but to attract the right traffic. This is the first critical filter. Ignore vanity metrics like impressions and clicks; they are easily manipulated and are poor indicators of lead quality. The goal here is to measure how efficiently you are attracting leads who fit your Ideal Customer Profile (ICP).
- Cost per Marketing Qualified Lead (CPQL): This is the bottom line of your acquisition spend. It is calculated as the total cost of a campaign or channel divided by the number of MQLs it generates, telling you exactly what you are paying for a lead that meets a predefined quality threshold.
- Visitor-to-Lead Conversion Rate (by Channel): This metric tracks the percentage of visitors from a specific channel (e.g., organic search, a technical conference) who take a meaningful action, such as requesting a demo or downloading an architectural diagram.
- ICP Lead Percentage: This is the proportion of all inbound leads that match your ideal customer criteria (e.g., industry, company size, technical role). A low percentage, even with high lead volume, signals a severe targeting problem.
Activation Stage: Demonstrating Value
Activation occurs when a qualified prospect begins to experience your solution’s value directly. This is not about counting webinar attendees; it is about measuring genuine buying intent. For a SaaS product, this could be a trial signup. For complex enterprise software, it might be a detailed, personalised demo or a proof-of-concept. This stage separates the merely curious from serious evaluators.
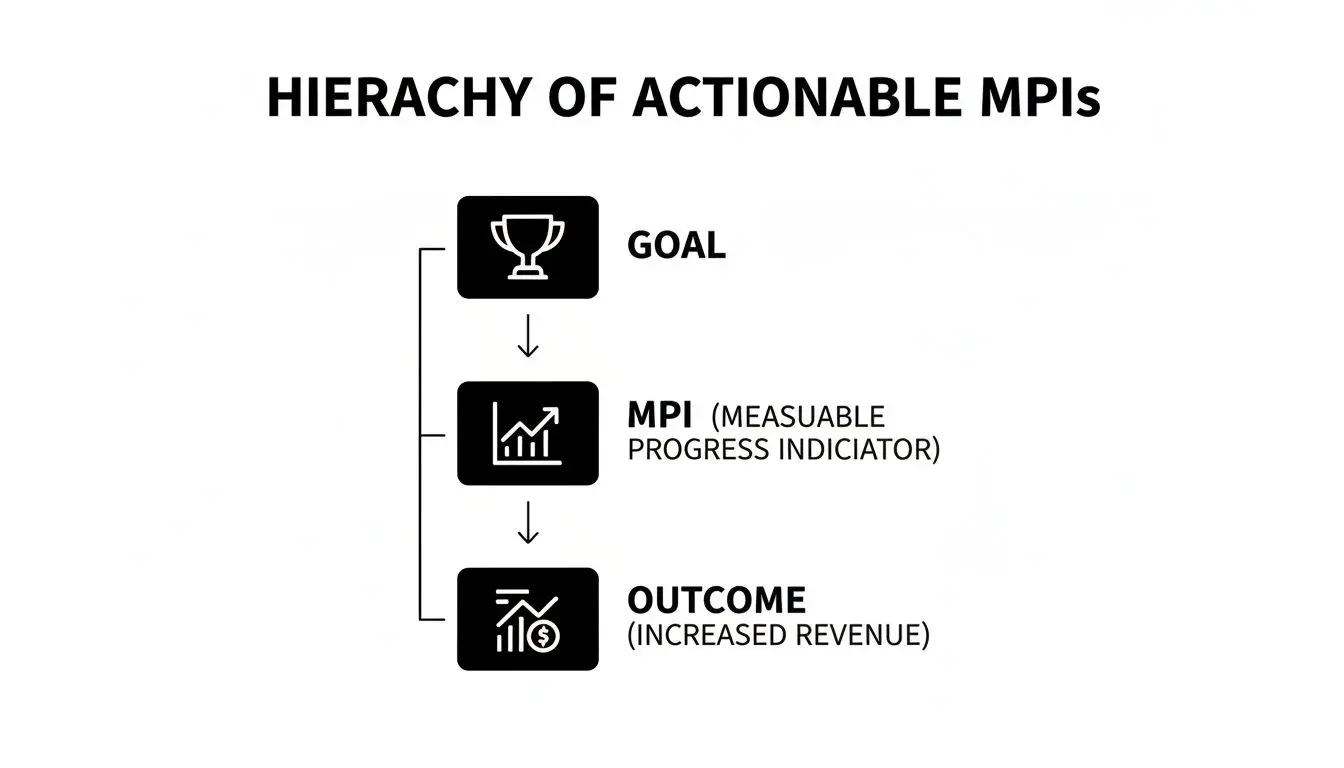
As the diagram illustrates, an effective MPI serves as the critical bridge between a high-level goal and a concrete business outcome. An MPI without a clear link to revenue is just noise.
Key MPIs for activation include:
- Trial or Demo Request Rate: The percentage of qualified leads who request a hands-on experience. This is a powerful signal of active evaluation.
- Product-Qualified Lead (PQL) Rate: For SaaS businesses, this tracks the number of trial users who reach a key activation milestone within the product, indicating they have experienced tangible value.
Conversion Stage: Closing the Deal
This is where marketing’s impact is measured against the bottom line. Conversion stage MPIs must connect directly to the sales pipeline and, ultimately, to revenue. A recent marketing trends report reinforces this, showing that top metrics for IT companies are lead quality (39%), lead-to-customer conversion (34%), and ROI (31%). The focus is squarely on financial impact. You can find more data and marketing insights in the report.
The health of your business is not determined by the number of leads you generate, but by the profitability of the customers you acquire. The LTV:CAC ratio is the ultimate arbiter of a sustainable growth model.
The most critical MPIs at this stage answer the question: “Is our marketing profitable?”
- Lead-to-Opportunity Conversion Rate: This measures the percentage of MQLs that the sales team accepts and converts into a formal sales opportunity. A low rate often points to a misalignment between marketing’s definition of a quality lead and sales’ reality.
- Customer Lifetime Value to Customer Acquisition Cost Ratio (LTV:CAC): This is the definitive MPI for sustainable growth. It compares the total projected value a customer will bring over their lifetime to the cost of acquiring them. A ratio below 3:1 is a strong indicator that the growth engine may be unprofitable.
By mapping these specific, outcome-focused MPIs across the customer journey, you build a clear, logical framework for measurement. This system helps you spot weaknesses, align marketing and sales, and make every dollar of spend accountable to the bottom line. For those tasked with making sense of this data, a skilled business intelligence analyst can provide a significant advantage.
Building a Measurement and Reporting Architecture
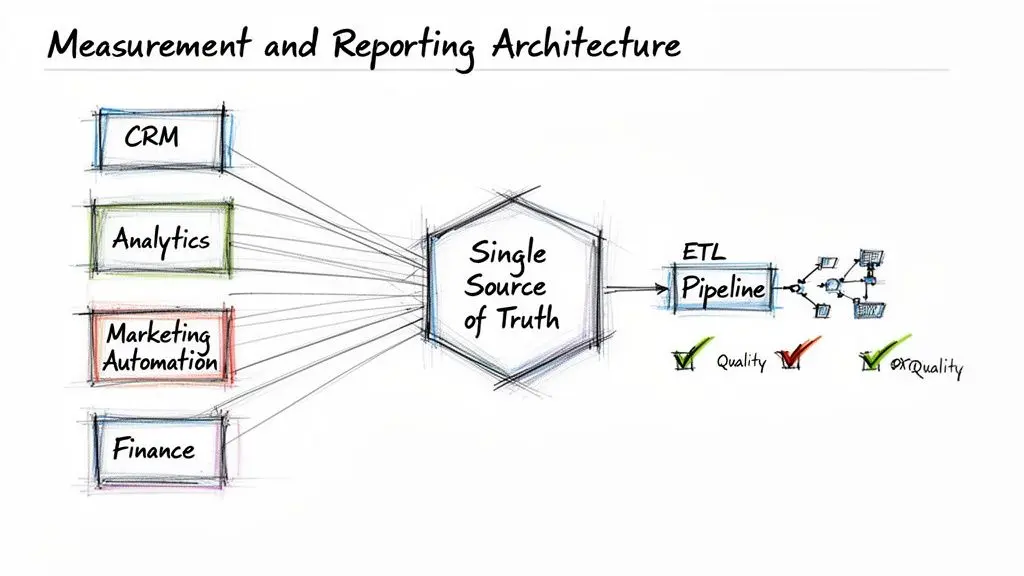
Tracking meaningful marketing performance indicators is not a marketing problem—it is an engineering and data architecture problem. Reliable MPIs demand a technical foundation built with the same rigour applied to any critical software system. Without it, your dashboards become works of fiction, leading to flawed strategic decisions and wasted capital.
The objective is to construct a single source of truth (SSoT) for all performance data. This requires architecting a system that ingests, cleans, and reconciles data from disparate sources, including your CRM, web analytics, advertising platforms, and payment systems. When you report on a metric like Customer Acquisition Cost (CAC), everyone in the organisation must see the same number, derived from the same data, using the same logic.
Designing the Data Pipeline
Building this architecture involves mapping the entire data flow. A robust marketing analytics pipeline typically consists of three stages:
-
Data Ingestion: This first step involves pulling raw data from the APIs of platforms like Google Analytics, your CRM (e.g., Salesforce), and various ad networks. The key is robust, automated extraction to eliminate manual errors and delays.
-
Data Transformation: Raw data is rarely usable in its native state. In this stage, data is cleaned (e.g., removing duplicates), formats are standardised (e.g., date schemas), and datasets are enriched by joining sources (e.g., connecting ad spend with CRM lead data).
-
Data Storage: The transformed data requires a central repository. This could be a SQL database for smaller operations or a cloud data warehouse like Snowflake or BigQuery for handling large, complex datasets.
A critical trade-off exists between using off-the-shelf integration tools and building a custom data warehouse. Packaged solutions offer speed of implementation but often lack the flexibility required for bespoke business logic. A custom warehouse provides complete control but requires significant engineering investment and ongoing maintenance.
Implementation Considerations and Technical Risks
A poorly designed data architecture is highly susceptible to data corruption. Several common technical mistakes can render your marketing performance indicators useless, creating a false sense of security or, worse, a false sense of crisis.
Data integrity is the bedrock of performance measurement. If your data is unreliable, your MPIs are meaningless, and your strategy is built on sand. Every architectural choice must prioritize accuracy and trustworthiness.
Key risks to mitigate include:
-
Flawed Attribution Models: Relying solely on the last-touch attribution models provided by ad platforms will invariably inflate their perceived value. A proper data architecture allows for the implementation of more sophisticated models (e.g., linear, U-shaped, data-driven) that assign credit across the entire customer journey. This requires stitching together user interactions from different platforms—a non-trivial but necessary engineering challenge.
-
Data Sampling Errors: To accelerate report generation, analytics tools like Google Analytics often resort to data sampling for high-traffic websites. For accurate financial reporting, sampled data is unacceptable. Your architecture must be designed to pull unsampled, raw data via APIs to ensure every conversion and every dollar of spend is accounted for.
-
Poor Data Governance: Without clear rules and enforcement, data quality degrades. This manifests as inconsistent UTM tagging, no clear schema for events, and multiple definitions for the same metric across different departments. Strong governance, enforced through code and process, is essential for maintaining a clean, trustworthy dataset. For a deeper look, see our guide on building a Data Management Platform.
Ultimately, your measurement system must be treated as a first-class product. It requires a pragmatic investment in architecture, data engineering, and governance—a foundation that pays for itself with clear, actionable, and accurate insights.
Setting Realistic Goals With Industry Benchmarks
Defining your MPIs is the first step, but without external context, your targets are merely arbitrary numbers. Setting goals in a vacuum is a common mistake that leads either to demoralising, unachievable targets or unambitious goals that breed complacency. To set effective targets, you must ground your MPIs in credible industry benchmarks.
However, blindly applying benchmarks is equally flawed. A benchmark for a B2C e-commerce brand is irrelevant for an enterprise software company with a 12-month sales cycle. The skill lies in identifying data specific to your domain—in this case, B2B software and IT services—and using it as a directional guide, not a rigid rule.
Context Is Everything in B2B Tech
The performance you can realistically expect is directly tied to your company’s maturity, market position, and target customer. A startup validating its first product has fundamentally different objectives than an established enterprise looking to modernise a legacy platform.
Consider these contextual factors when evaluating any benchmark data:
- Company Stage: A seed-stage startup might fixate on a high demo request rate to prove product-market fit, even at a high Cost Per Lead. A scale-up, by contrast, will be laser-focused on optimising its LTV:CAC ratio for profitable growth.
- Market Maturity: Entering a crowded, mature market means you should expect higher Cost Per Click (CPC) on paid channels. If you are creating a new category, your early focus will be on market education, making top-of-funnel awareness metrics a higher priority.
- Target Audience: Selling to enterprise CTOs involves a long, relationship-driven process that yields a low volume of extremely high-value leads. This is vastly different from selling to SME operations managers.
Actionable Benchmarks for B2B IT in 2026
To provide a concrete reference point, here are some current benchmarks for the B2B IT and software industry. According to 2026 data, the target ROI on marketing campaigns in the IT sector is a challenging 10x. To achieve this, companies are aiming for +20% month-over-month growth in web traffic and a web-to-lead conversion rate of 2.5%.
On paid acquisition channels, the average Google Ads click-through rate (CTR) is approximately 4%. The CTR for LinkedIn Ads, by contrast, is much lower, typically ranging from 0.4% to 0.65%. These figures illustrate how optimised a strategy must be to drive growth. You can explore more 2026 IT marketing predictions on LaunchTeam for a deeper analysis.
Benchmarks are not a finish line; they are a compass. They indicate direction and provide a scale for your map, but you must still navigate the specific terrain of your business context.
Using these numbers as a guide helps leaders set credible expectations with their boards and teams. If your web-to-lead conversion rate is only 0.5%, you know you have a significant performance gap relative to the 2.5% benchmark. This immediately prompts the right questions: is our website traffic irrelevant, or is our value proposition failing to resonate? This data-informed approach transforms goal-setting from guesswork into a strategic exercise, helping you calibrate your marketing engine for sustainable, profitable growth.
Implementing Custom MPI Dashboards for Actionable Insights
Standard analytics dashboards included with SaaS platforms are designed for the average user. While convenient, they provide a generic view of performance, often cluttered with vanity metrics that cannot answer your most critical business questions.
To gain a true competitive advantage, you must move beyond these pre-built reports. This requires a bespoke measurement system, engineered around the specific marketing performance indicators that drive your business.
A custom dashboard is more than a collection of charts; it is an engineered solution that integrates disparate data from your CRM, marketing automation platforms, and finance systems into a single, unified, and trustworthy view. This single source of truth is what finally dismantles the data silos that lead to conflicting reports and a systemic lack of confidence in performance data.
From Business Questions to Technical Design
The process begins not with data, but with a focused discovery phase. A technical partner works with key stakeholders to identify the core business questions that require answers. These are not merely marketing questions; they are strategic business questions.
- What is the true, fully-loaded Customer Acquisition Cost (CAC) for each marketing channel?
- How does our Lead-to-Opportunity Conversion Rate vary by lead source or prospect industry?
- What is the precise LTV:CAC ratio for customers acquired through paid advertising versus organic content initiatives?
Only after these critical requirements are defined does the technical implementation begin. This involves designing a data architecture to ingest, clean, and model data from multiple, often inconsistent, sources. It means building a robust data pipeline to ensure every number is reliable and auditable. For instance, instead of accepting a platform’s default last-touch attribution, a custom solution can implement a multi-touch model that accurately reflects the complex journey of a B2B buyer.
A custom MPI dashboard transforms data from a passive reporting tool into an active decision-making engine. It provides not just information, but intelligence—clarity on what is working, what is not, and where to invest the next dollar for maximum impact.
Building a Solution That Lasts
The final step is creating interactive visualisations that provide clear, immediate answers to your core questions. The goal is to build a system that is not only powerful but also scalable and maintainable. This ensures your dashboards can evolve with your business, delivering sustained value for years to come.
A well-architected solution delivers more than charts; it delivers confidence in your data. That foundational trust is essential for making the bold, data-driven decisions that fuel real growth. Building a custom system is a significant undertaking, but it is a necessary one for any company that wants to turn its marketing into a predictable, high-performance growth engine. You can learn more about the principles behind building effective business analytics software in our detailed guide.
Frequently Asked Questions About MPIs
Even with a clear framework, implementing MPIs raises pragmatic questions. Here are concise answers to common queries from founders, CTOs, and product leaders.
What Is The Difference Between A KPI And An MPI?
While often used interchangeably, the distinction is critical for technical and business leaders. A Key Performance Indicator (KPI) can be any metric you choose to track—website visits, email open rates, social media followers. They are often measures of activity.
A Marketing Performance Indicator (MPI), as we define it, must be directly and quantifiably tied to a strategic business outcome, such as revenue or profitability. Examples include Customer Acquisition Cost (CAC) and Marketing-Sourced Revenue.
MPIs answer the question, ‘Is this activity growing the business profitably?’ KPIs, in contrast, often only answer, ‘Are we busy?’ For a technical leader, insisting on MPIs is how you ensure marketing is accountable to financial goals, not just activity quotas.
How Many MPIs Should We Track?
Fewer is almost always better. A common mistake is tracking dozens of metrics, which creates noise, dilutes focus, and leads to analysis paralysis. A bloated dashboard tells you nothing of value.
A focused hierarchy is more effective:
- Primary MPIs (1-2): Choose one or two top-level indicators reflecting your ultimate business goal. Excellent examples are the LTV:CAC Ratio or total Marketing-Sourced Recurring Revenue.
- Secondary MPIs (3-5): Add a small set of diagnostic metrics for key funnel stages. These explain why your primary MPI is changing. Examples include Cost per Qualified Lead or your Lead-to-Opportunity Conversion Rate.
This structure allows for at-a-glance monitoring of business health while providing the tools to diagnose specific issues without getting lost in irrelevant data.
Our Dashboard Shows High Engagement But Sales Are Flat. What Is Wrong?
This is a classic symptom of the ‘Marketing Data Mirage.’ In a complex B2B technology sale, ‘engagement’ metrics like clicks, content downloads, or social media likes are extremely poor proxies for genuine buying intent.
Your ‘engaged’ audience likely consists of students, competitors, industry analysts, or junior-level employees with no purchasing authority. The problem is not your top-of-funnel activity; it is the flawed metrics being used to measure success.
The solution is to shift focus downstream. Begin by analysing the conversion rate from these ‘engaged’ users into sales-qualified opportunities. Your lead scoring model must heavily prioritise firmographic data (company size, industry) and behavioural signals that indicate genuine intent, such as a prospect requesting a personalised demo or visiting your pricing page multiple times.
What Is The First Step To Improve Our Marketing Metrics?
The single most effective first step is a manual audit. Before investing in new tools or complex dashboards, work backwards from your last 5-10 closed-won deals.
Use your CRM data, but more importantly, interview your sales team to map out each customer’s actual journey. Ask critical questions:
- Which specific channel first brought this customer to our attention?
- What content did they consume before engaging with sales?
- Was there a single event, demo, or conversation that was pivotal in moving the deal forward?
This qualitative, evidence-based analysis will quickly reveal which activities and metrics actually correlate with revenue. It provides a solid foundation for building a focused MPI dashboard and gives you the confidence to ignore the vanity metrics that do not drive growth.
Building a reliable system to track your marketing performance indicators requires more than just a dashboard; it requires a robust technical architecture. At Devisia, we specialise in creating custom software solutions—from data pipelines to bespoke analytics platforms—that turn your business vision into maintainable, high-value digital products. Learn how we can help you build the systems you need to drive measurable growth.